Introduction1
Ranking college football teams is hard. There are numerous reasons for that. However, it boils down to too few datapoints. There are 136 teams in FBS2 and during the regular season each team only plays 12 games3. The opponents are comparable, teams also play one (sometimes two) FCS team4. Even within FBS there are a wide range talent that is hard to quantify. The most common way is to distribute the conferences by “prestige”/”power”/”money”:
- Power 2 (P2): The tippy top in money and power: Big Ten (B1G) and the Southeastern Conference (SEC)
- Power 4 (P4)5: an actual designation in NCAA bylaws that gives these conferences more autonomy than everyone else. It includes the P2 and the Big 12 and the Atlantic Coast Conference (ACC)6.
- Group of 6 : everyone else. It includes the Pac-12, the American (AAC), Mountain West (MWC), Sun Belt, Mid-America Conference (MAC), Conference USA (CUSA) more or less in this order.
There are multiple models that try to rank, explain or prognosticate individual games. I won’t bother listing them here but they are a quick search away. One of these is called SP+7 developed by Bill Connelly (now at ESPN). For a full explanation go the here. He has also developed his own take on strength of record8, Resume SP+9. The main difference is that SP+ is forward facing and Resume SP+ is backwards facing.
I was interested in what the relationship between those two were. More importantly, I want to investigate if by combining both I could classify teams in groups (clusters) of like teams. Above all, I wanted to prove a point.
Northwestern is the same as Mississippi State.
Despite both being considered P2, the B1G and the SEC have very different reputations, especially this year. The argument goes like: every game is hard in the SEC and the good teams in the B1G are feasting on Purdue a bunch of times. What actually means is that the B1G teams end up underrated and the SEC overrated. In the point above, if a team beats Northwestern on road by 7 it is treated as disaster, if the same happens against Mississippi State, it is treated as a tough test against a good team. That matters since the method of reaching the playoffs is a Selection Committee that is very influenceable10.
Method
Time for some MATH!
All I did was download Bill Connelly’s data and run a relatively simple k-means clustering between SP+ (always in the X axis) and Resume SP+ (Y axis). This analysis can be done in a lot of ways but I used the simplest: Squared Euclidean distance11. The result is splits the data in a arbitrary number of groups of similar data points. One of challenges is that there are infinite solutions for any given dataset. Particularly with large samples (n>5). In order to avoid getting a different solution every time I run the code12, I had the algorithm solve each dataset 100 times and return the best solution13.
NOTE: These figures suck but I won’t be making them better because I am not getting paid for this.
Results
tldr: I am right.
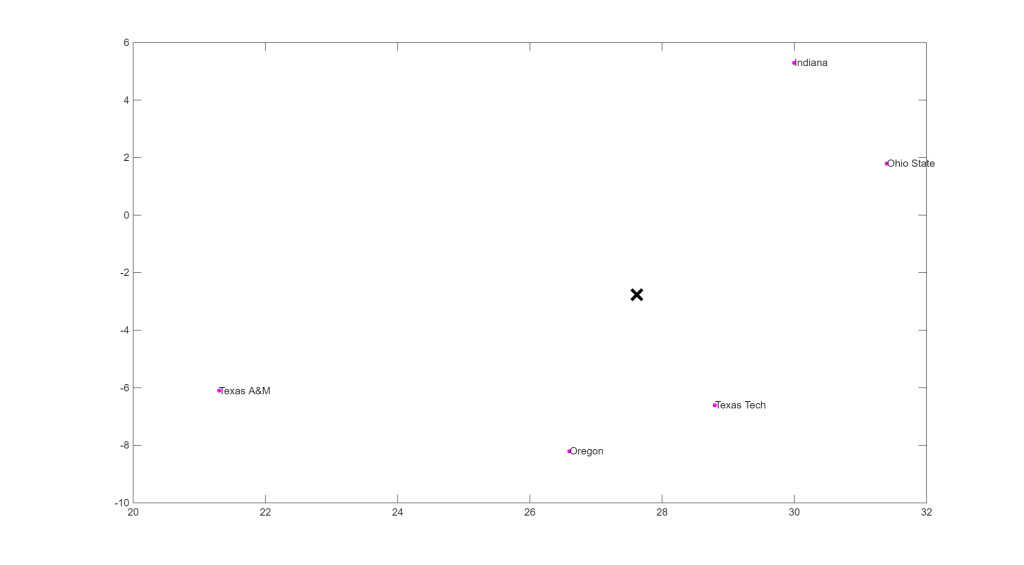
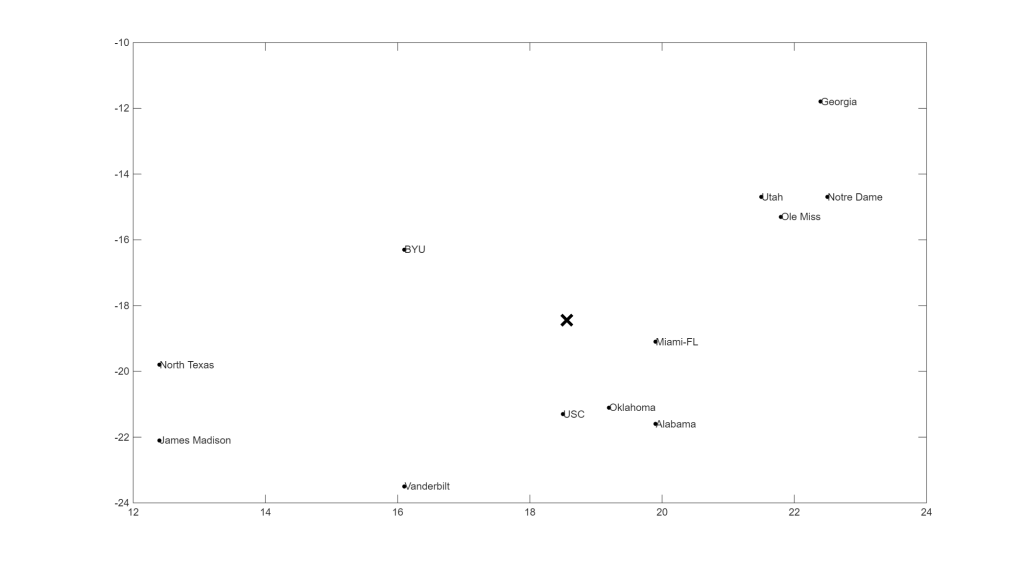
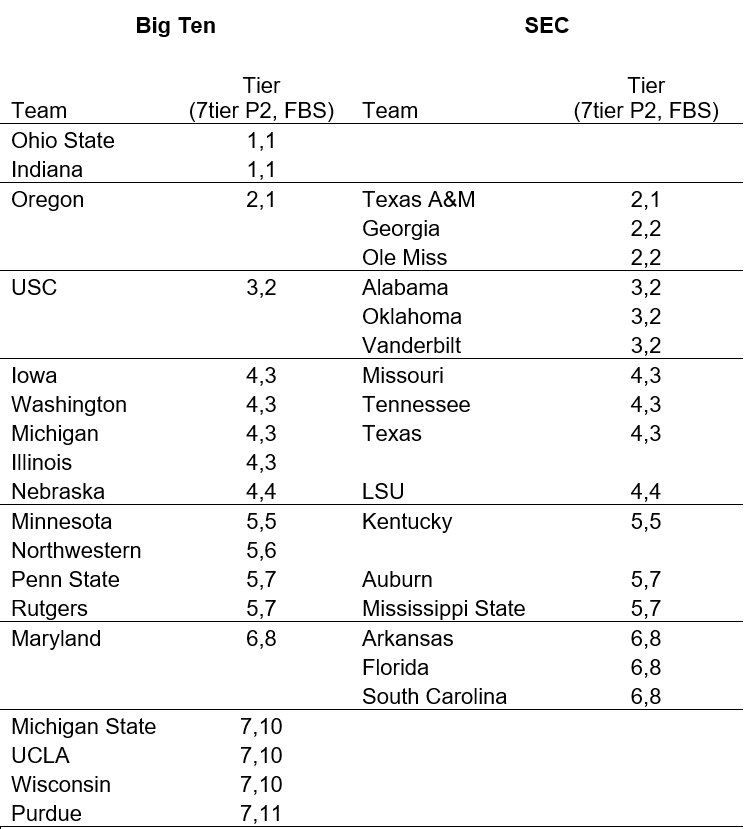
First let’s look at a P2 only. I landed on either four or seven tiers14 as the best ones (Figure 1a and 1b) .
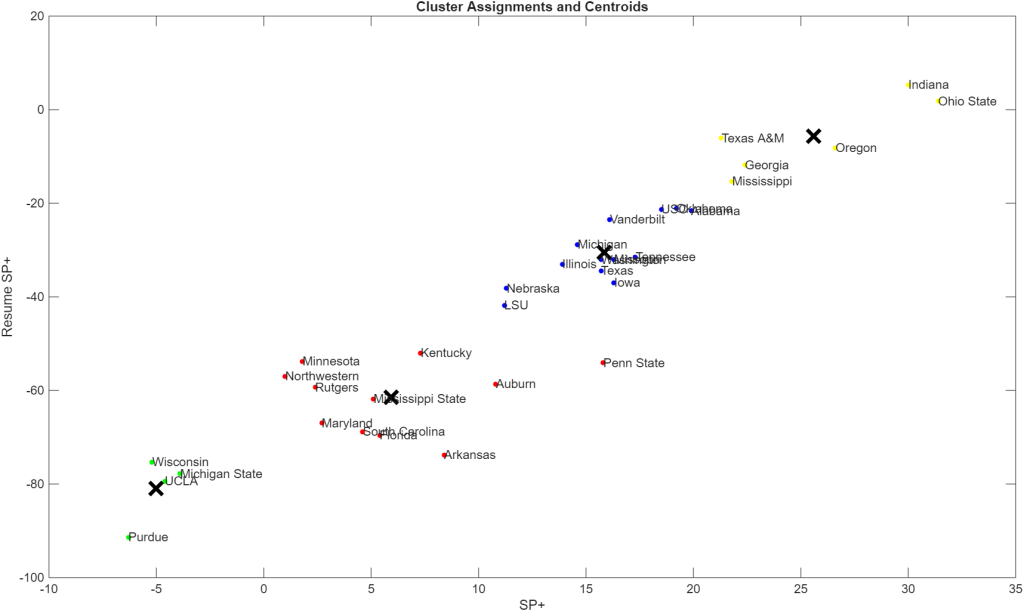
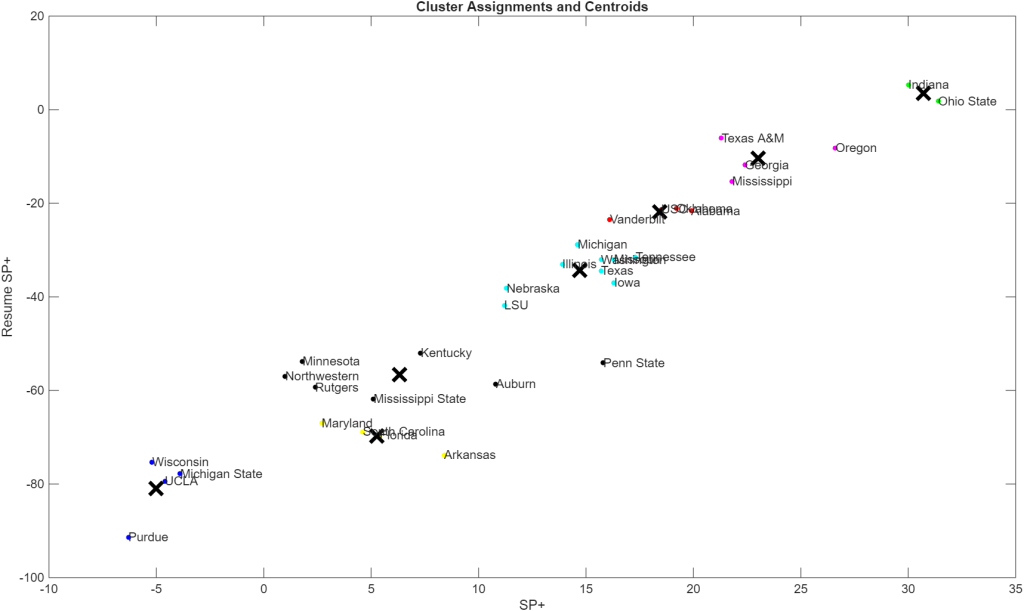
Either analysis gives you roughly the same conclusion. In the 4 tier version, the B1G has a cluster of much worse teams than the SEC (Purdue, Wisconsin, UCLA and Michigan State). On the other hand, the B1G has two teams (Ohio State, Indiana) that are head and shoulders above the others and stretch the top tier (Oregon, A&M, Georgia and Ole Miss). This effect is way more visible in the 7 tier version. The bottom tier is the same15 but the top tier is Ohio State and Indiana by themselves.
The really interesting tiers, however, are the middle two in the 4 tier version and 3 through six in the 7 tier version. These are the bulk of the teams. Of note, Northwestern and Miss State are in the same tier both times along with a lot of other bad teams. Now, for serious analysis: we have clear split between good and bad teams in the 4tier. They get further split in the 7 tier with playoff aspiring teams Alabama, USC, Vanderbilt and Oklahoma clearly away form the mess. On the other end we have the disappointing teams tier: Maryland, South Carolina, Florida and Arkansas.
Speaking of disappointing teams, the talented but underperforming teams (Penn State, Arkansas and Auburn to a lesser degree) are the biggest issues to the solutions. They sit away from the main group and very well could be outliers, which talented teams with bad records should be.
To investigate the outlier hypothesis I combined all the teams in FBS in a regression model (Figure 2). It’s quite linear with a reasonable R2 of 0.8748.
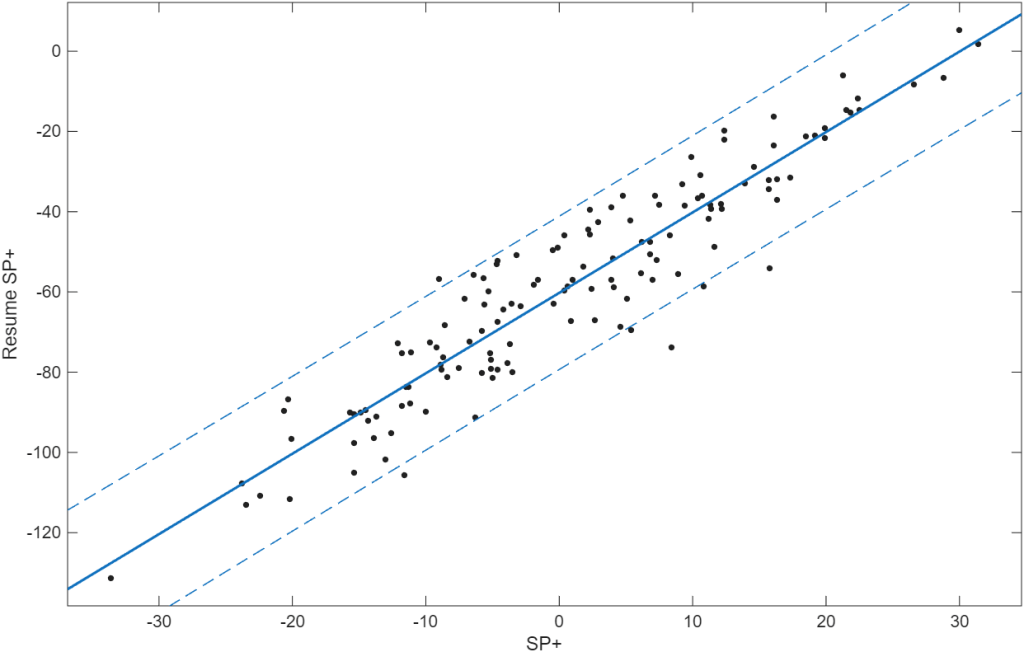
There are a few points outside of the 95% confidence interval bands. Penn State, Arkansas, Missouri State, Boston College are clearly outside and on the line we have Auburn, Florida and Purdue. The only one above the the top band is Missouri State that is overperforming vastly. All the others are underperforming so badly that it is noteworthy. All are P4, only Boston College is not P2 and getting terrible results. Four of these (Arkansas, Auburn, Penn State and Florida) have fired their coaches already. The other two Purdue and Boston College are under resourced teams playing high level competition16. Purdue is on year one of a new coach (Barry Odom) after a historically bad two year run with its previous coach (Ryan Walters)17. BC is in year two of Bill O’Brien’s tenure. He took over a not so good team very late last year and this is his first full offseason to build the roster. BC whiffed on a lot of transfers (including former 4 star quarterback Dylan Lonergan) and lot NFL talent in both lines. I personally don’t think that firing them solves anything. These programs both need more money to compete pure and simple.
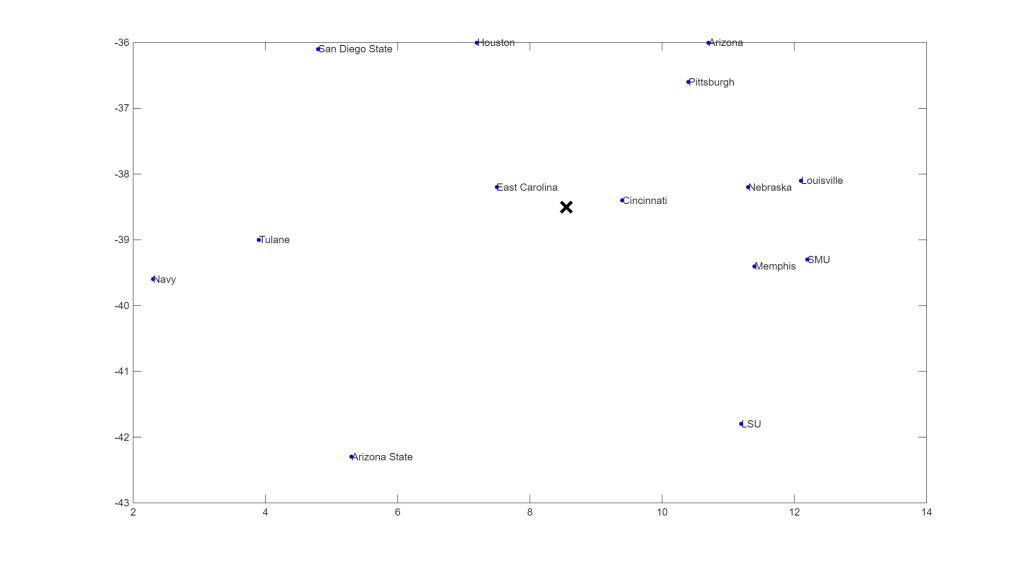
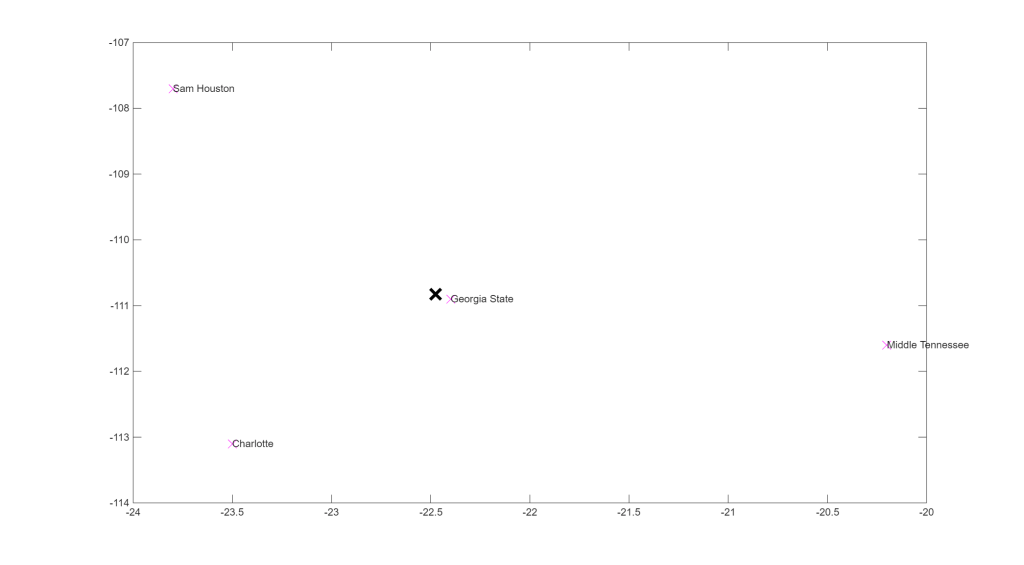
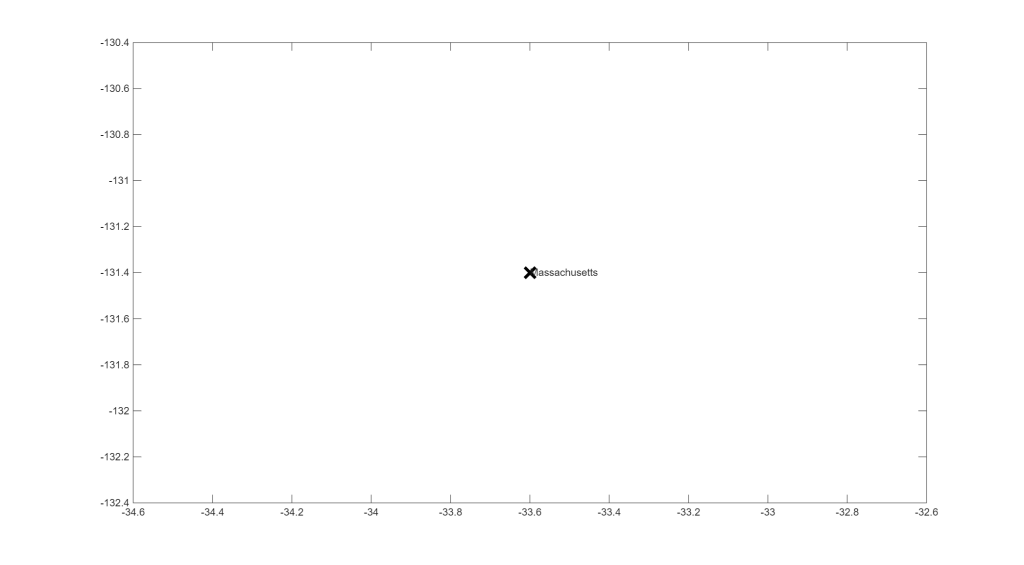
Next I used the full data to look for tiers, I doubled the number of tiers to account for all the extra teams coming in (Figure 3).
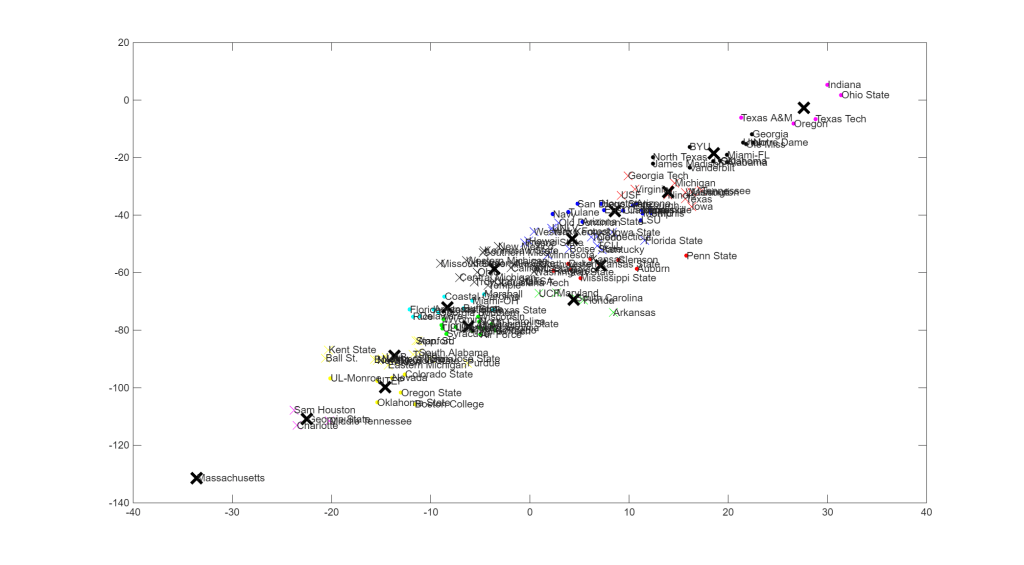
Well that’s a mess. UMass stands alone as the worst team in FBS. Let’s look at each tier from top to bottom and try to make sense of them18.
Tier 1: Title Contenders
Honestly there’s not much to say here. The best of the best. All big spenders. Look at you Texas Tech!
Tier 2: Playoff caliber
Not many surprises here, except JMU and North Texas far to the left (low SP+, future facing, with a high Resume SP+, good results). The four on the top right should be on the conversation to only make the playoff but challenge for the title. Of those four, only Utah is not in the latest playoff picture19. The top two tiers have 17 teams for 12 spots. JMU and North Texas are unlikely to make it together or at all due to being relegated to fifth conference champion status.
Tier 3: Good teams
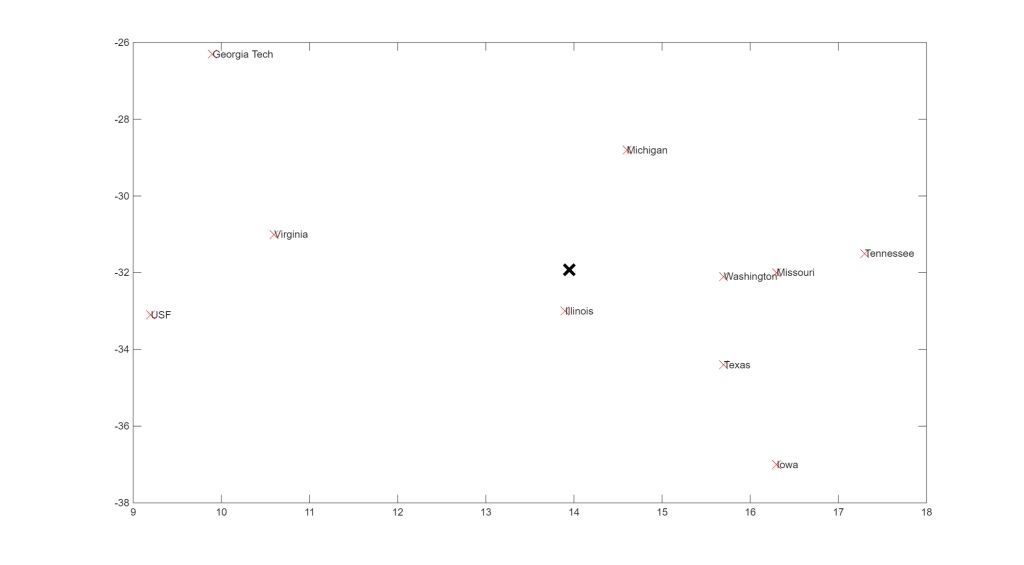
All of these teams have some sort of glaring weakness that keep them from the top (read Playoff) tiers. Except for Texas, these teams came into the season with tempered expectations. Questions at QB or offensive line are present for all but Georgia Tech, Virginia and USF. The other three main challenge is the conference they play in ACC (Ga Tech and UVA) and AAC (for USF). Funnily enough they are on the far left of the cluster indicating higher similarity between them and that their record is overperforming their production20.
Tier 4: Confusing teams
Have you ever watched a team and wondered what the fuck is going on here? Are they in this group? Probably.
Tier 5: Surprising teams
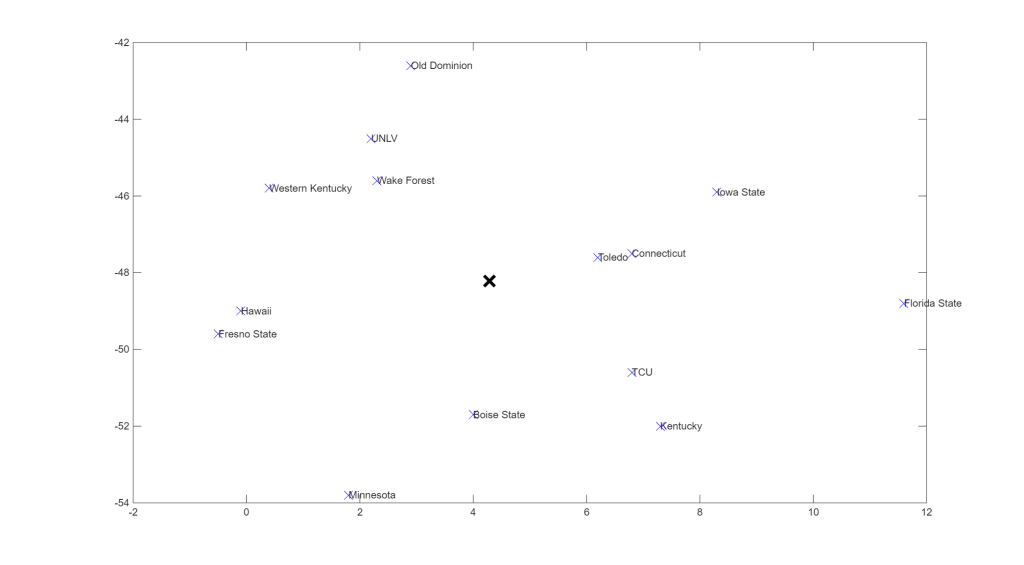
Surprising goes both ways. Fresno State, UConn and Florida State are here. So are decidedly unsurprisingly medium teams Minnesota, Iowa State and Kentucky.
Tiers 6 and 7: Plucky underdogs and Dogshit powers
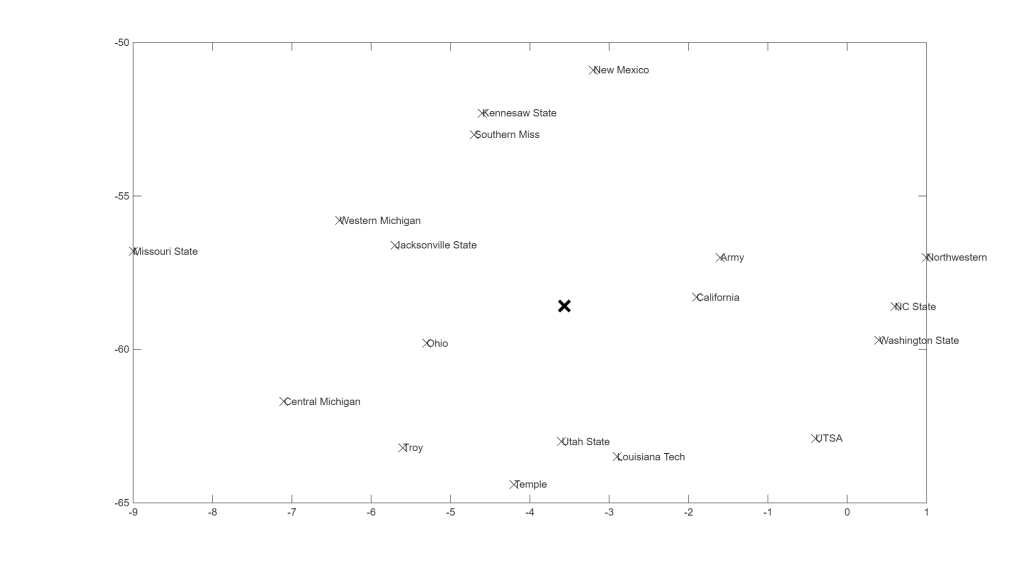
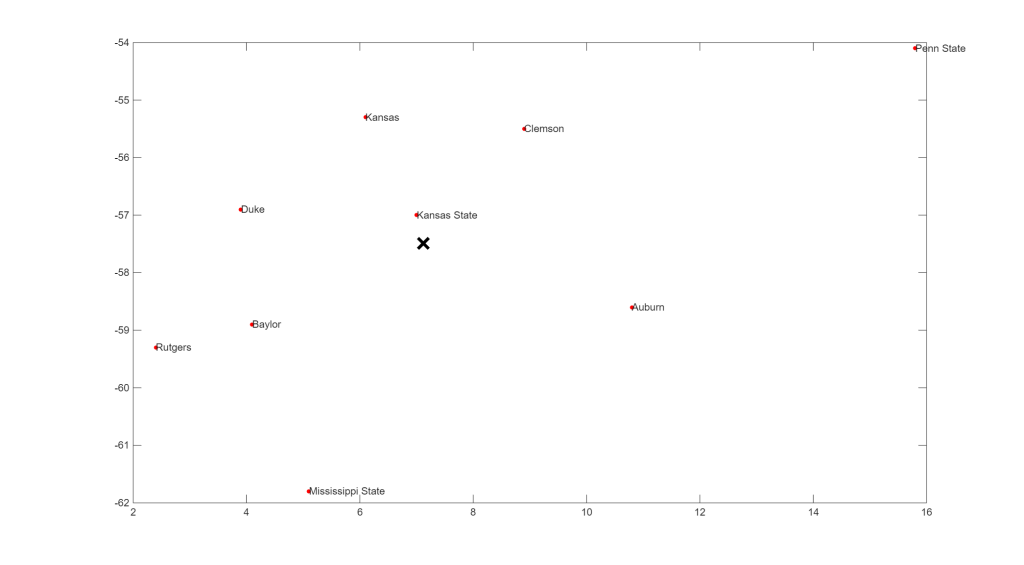
Pardon the pun, the descriptors are accurate. These tiers are almost on top of each other. Tier 6 has overperforming G6 teams including outlier Missouri State and Tier 7 has the underperforming outliers Penn State and Auburn. For those scoring at home, Northwestern is (barely) on Tier 6 and Mississippi State is on Tier 7. Makes you think. Cal and NC State are the only other power conference teams in Tier 6 which is apt I think.
Tier 8: Disappointment
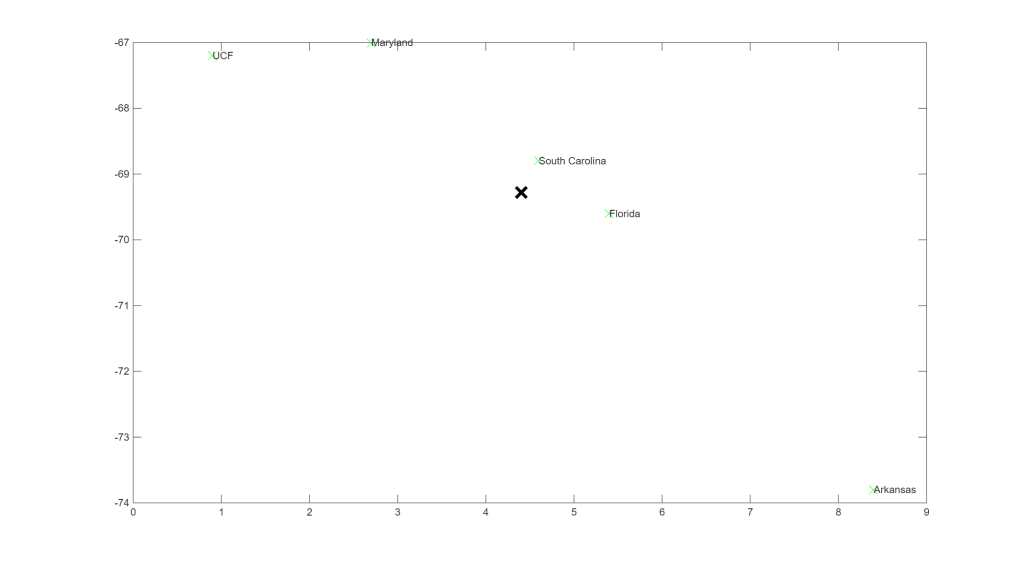
Yep.
Tiers 9 and 10: Average G6 and Bad P4s
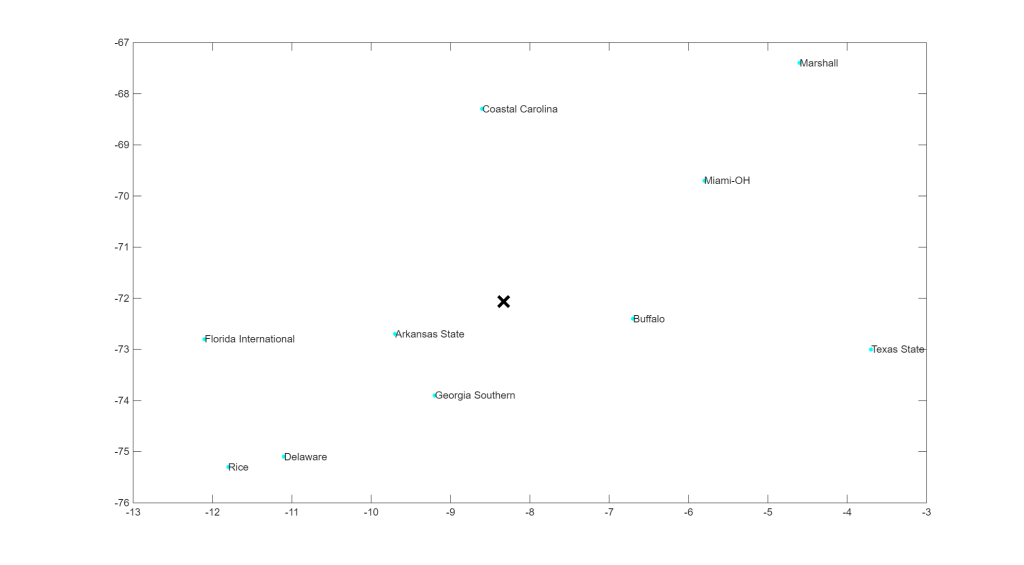
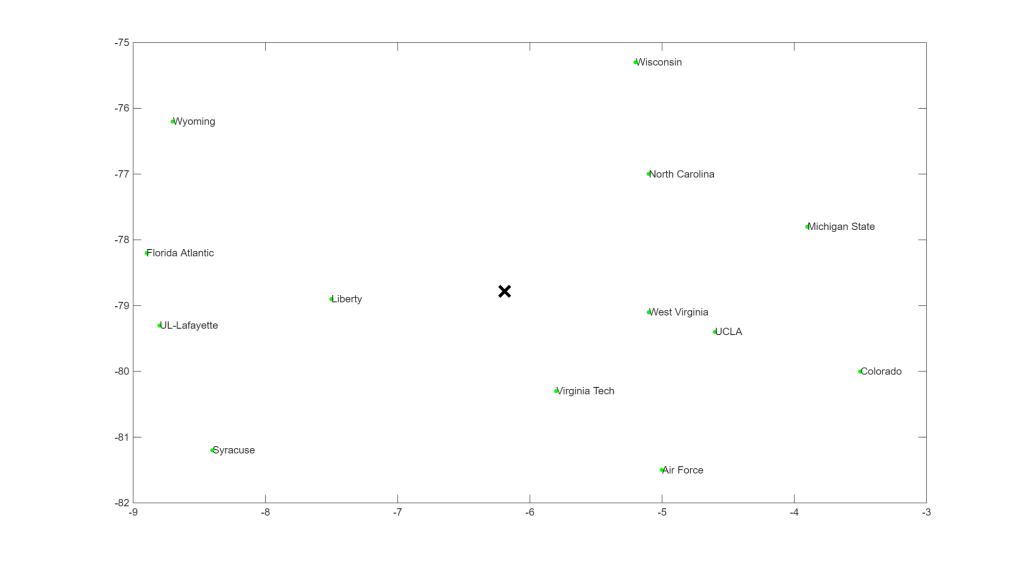
Being in these tiers is bad. You are not the literal worst but you are not covering yourself in glory. If you have any sort of expectations, it is terrible. Teams in T10 are all interesting in off the field ways. North Carolina, UCLA, Colorado, and West Virginia all have peculiar coaching situations. Syracuse has no healthy quarterbacks. The rest are thrown in for fun I guess. Tier 9 is full of mid teams which is great for Delaware, Marshall and Rice based on where they were last year/offseason.
Now to the GOOD stuff
Tier 11: I am surprised there are worse teams than us
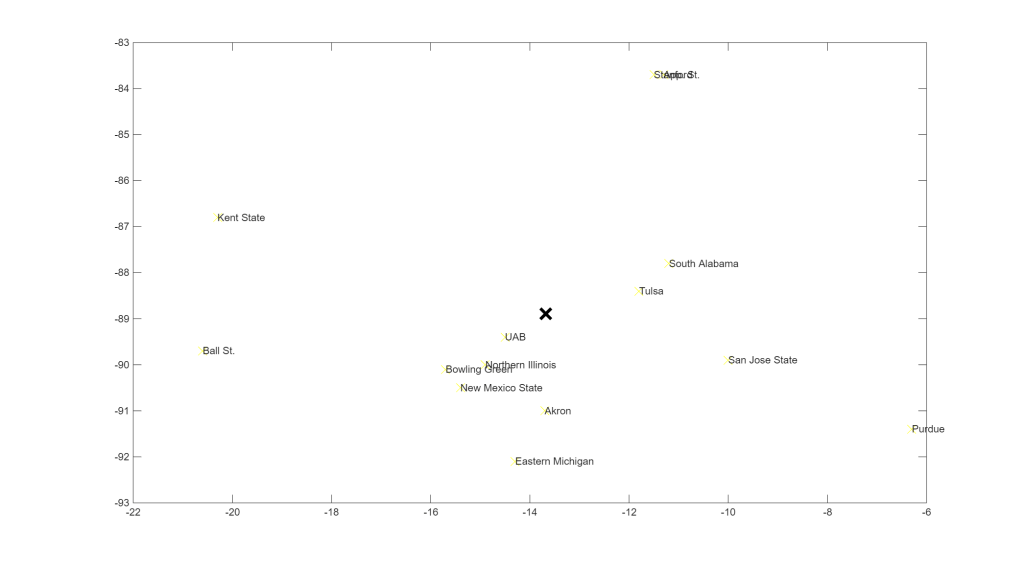
Purdue is a MAC team! Boiler Up!
Stanford and App State are identical institutions.
Tier 12: We know we are bad ok
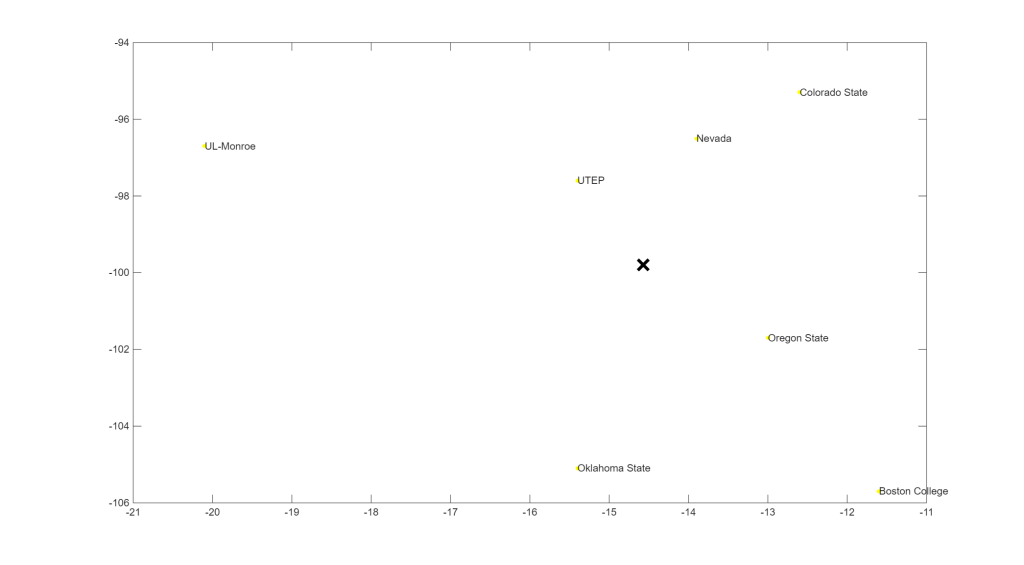
If I had to guess the worst teams in the P4 Oklahoma State or Boston College, so it is fitting they are here together. Perpetual bad situations ULM, UTEP, Nevada, Colorado State and poor Oregon State are here to give them cover.
Tier 13: Thank God for UMass
In a normal season these would be the worst teams in FBS. However, it is not.
Tier 14: UMass is historically bad
That’s just sad.
Random musings
This not super rigorous analysis shows:
- There is a lot of mid in college football.
- Money rules.
- I am right (mostly).
- Adjusting stats to opponent quality is hard and very influential to both subjective and objective analysis.
- Utah should be in the playoffs.
- Clemson and KState are so much worse than my low opinion of them.
Things to look into (or not)
I am very curious to see if the tiers correlate to significant swings in predictions against the spread.
Would readjusting SP+ ratings iteratively with updated tiers improve the outcomes? Does Bill C already do this?
Takeaways/Conclusions
It is all interesting but it is all that it is right now. No one is going to win arguments with this data but it was fun to do.
- You can skip if you know something about college football. ↩︎
- The highest level of competition in the NCAA, a subdivision of Division I. Each school can offer up to 105 scholarships. ↩︎
- There are exceptions. Mainly, if a team plays at Hawaii, they can play a 13th game. ↩︎
- Second highest level of competition, the other subdivision of Division I. Each school can offer up to 63 scholarships. ↩︎
- This group used to be P5, until the Pac-12 got ripped apart by the Big Ten. ↩︎
- Notre Dame is an independent in football and ACC for everything else. In football, for all intents and purposes exists by itself as a power. ↩︎
- No, I don’t remember what it stands for. ↩︎
- You gonna have to google that one too. ↩︎
- Résumé SP+ compares each team’s scoring margin (capped at 50 points for a given game) to what an average top-five team would be expected to generate against a given opponent. If a top-five opponent would be projected to win a game by 10.0 points, and a team wins by 15 instead, that’s a +5.0 rating for that game. By the end of the season, only a handful of teams will have a positive rating because clearing a top-five bar is obviously very difficult. (Note: A seven-point penalty for losses is applied to the rating as well, meaning your rating has seven points deducted for each loss.) From this week’s article: https://www.espn.com/college-football/story/_/id/46128861/2025-college-football-sp+-rankings-all-136-fbs-teams ↩︎
- Current playoff picture has 5 SEC teams and 3 B1G teams. https://www.espn.com/college-football/story/_/id/47016215/college-football-playoff-2025-byes-bracket-new-top-25 ↩︎
- Math for the math gods: d(x,c)=(x−c)(x−c)′ ↩︎
- Matlab ↩︎
- Lowest Sum of Errors. ↩︎
- The max number of preset colors in Matlab. ↩︎
- There is a possible solution that splits Purdue from the other 3 which is very funny to me. ↩︎
- NIL and roster payroll are low compared to its peers. ↩︎
- Odom has a significantly higher budget for players and assistants that is still lower than the rest of the B1G. ↩︎
- Fair warning. These figures were generated to minimize my work not to be good looking. ↩︎
- Subdividing the tiers is not particularly good or correct but I am doing it anyway. ↩︎
- Production adjustments are crucial part of the model and that can be explain some of the effects we see. ↩︎
