Simple question: which job is better?

Would you rather coach at Michigan State or Mississippi State? Tennessee or Texas? Texas or Texas State? How about Texas Christian TCU?
There’s no way to create a absolute list that will satisfy everyone. This is not an attempt to create that. There are too many personal values that will completely change any given list. What I am aiming for is a framework for decision-making.
Presenting the Job Quality Index (JQI) and its sibling the Expectation Adjusted JQI (JQIX).
The JQI is depends on three variables:
- Athletic Revenue. I used total athletic revenue as report in 2021-2022 (https://sports.usatoday.com/ncaa/finances). The list does not include private schools and I will discuss how I addressed it below.
- Team talent composite rankings average between 2015-2023 (data from https://collegefootballdata.com/).
- Playoff probability as defined by me. A category that follows the scale in the table below. I will discuss how much it matters or not latter.
| Playoff Probability (PP) | Level | Explanation | Example |
|---|---|---|---|
| Championship | 7 | Competes for the National Championship every year | Ohio State, Georgia |
| Very High | 6 | Makes it every year (should go undefeated or x-1 every year and still make it) | LSU, Michigan |
| G5 Contender | 6 | Make it every year if they go undefeated (G5 Conference champion, Best G5) | Boise State |
| High | 5 | Compete to make it every year (comes down to one or two big games every year) | Penn State, Texas |
| Average | 4 | Every year there’s a nominal chance (a great year should get you in) | Iowa, Pitt |
| Low | 3 | Small chance (need a great year and others to have a bad year) | Most G5, Kentucky, Purdue 😦 |
| Very Low | 2 | A miracle is needed | UConn, Rice |
| None | 1 | Self-explanatory | Vandy, UTEP |
JQIX adds an expectation factor. Each school gets a rating for expectation of playoff chances. The adjustment is 0.1*(PP – EPP). JQIX = JQI + 0.1*(PP – EPP).
How does this model actually work?
I added all 132 FBS teams with their affiliations starting in 2024. Revenue and Team Talent are considered as rankings with higher ranking being higher revenue or higher talent. Both are normalized between 0 and 1. Each PP gets the level normalized between 0 and 1. And boom add the three.
JQI = Revenue Rank/132 + Talent Rank/132 + PP Level/7
Without further ado, Top TEN jobs:
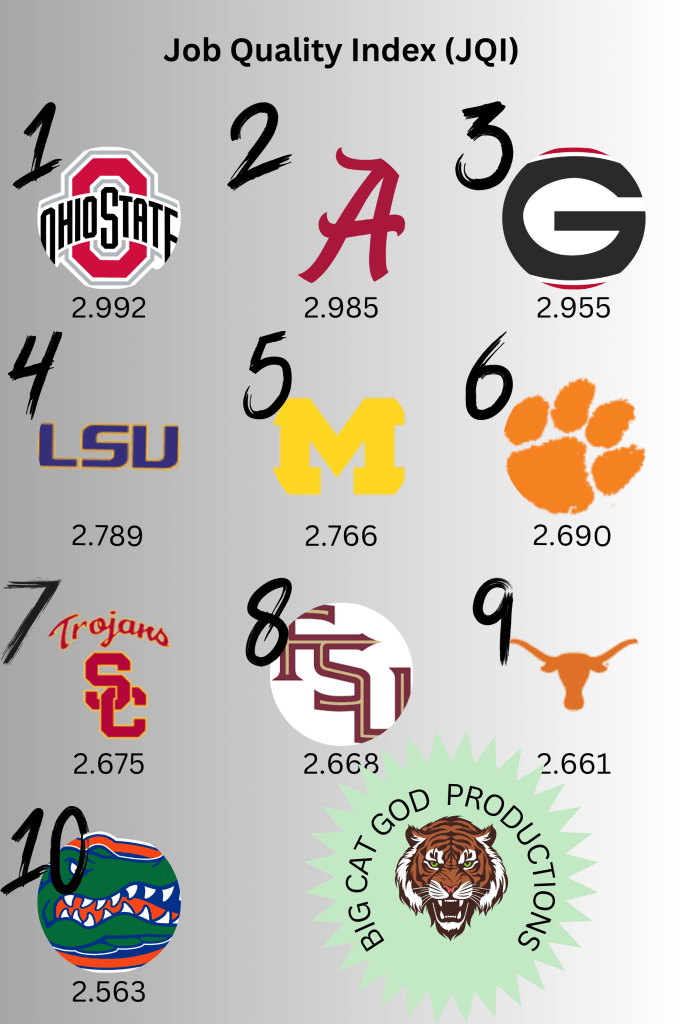
Pretty what you would expect huh.
Bottom TEN jobs:
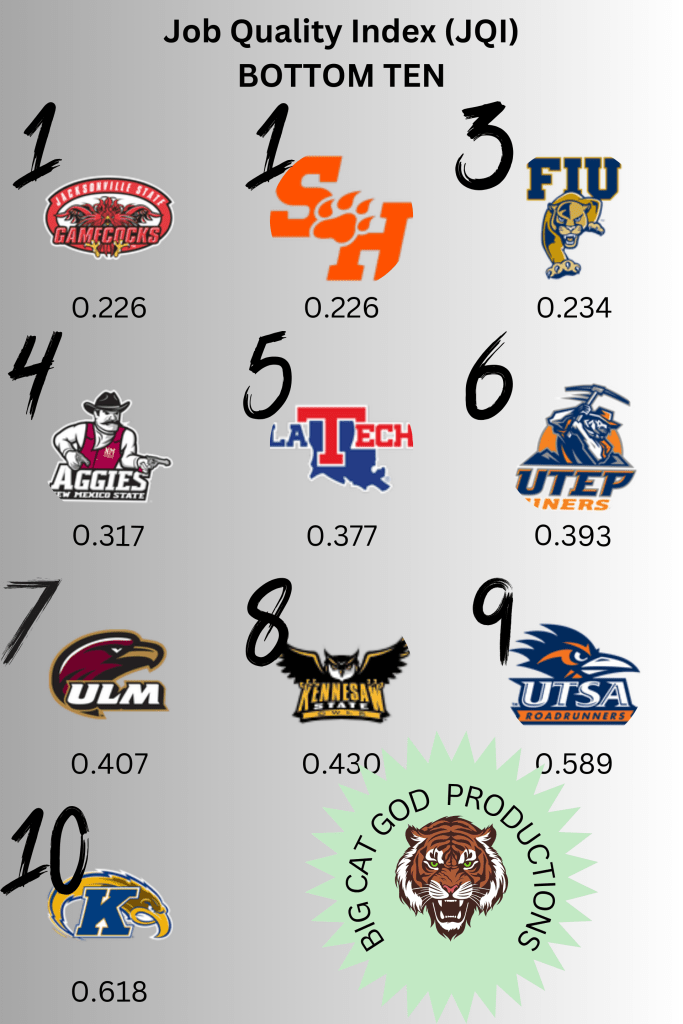
The long and the short is the CUSA is bad. Having Liberty in the conference actually makes things worse for the other teams from a competitiveness stand point.
The CUSA almost hid the fact that the MAC is horrific. Kent State is the only one in the bottom ten. But, in the bottom 11-20, half of them are MAC. It is a very flat conference all programs are between 87 (WMU) and 123 (Kent State). The bottom seven programs are only separated by 10 spots. If you remove Western Michigan and Toledo, they are all below 100th. It is a double edged sword, everybody can compete to win it but no program cannot dominate.
How does the Expectations change the rankings?
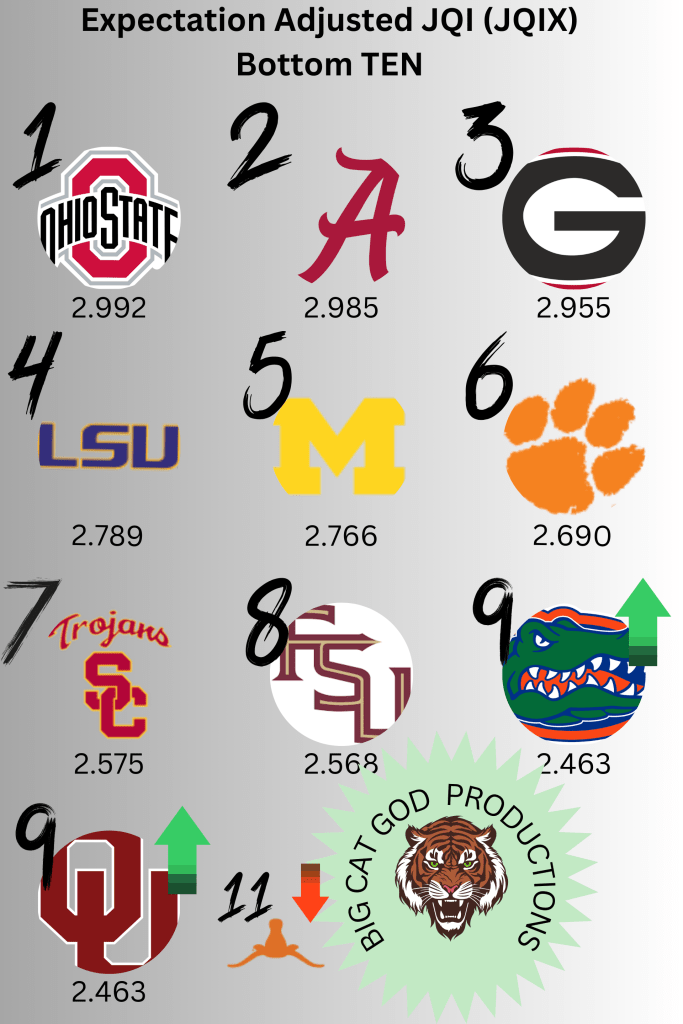
At the top thing don’t really change! It makes sense, if you have a championship program, you also have championship expectations. That’s where Texas falls, it expects Championships but the PP is only High. Oklahoma comes up to 9 and ties Florida. That is not to say that its PP is better than Texas (it is not), but the expectation of only Very High catches them up. The JQIX is actually 2.463 for OU and 2.461 for Texas aka same job really.
Who are the biggest winners and losers when expectations are factored in?
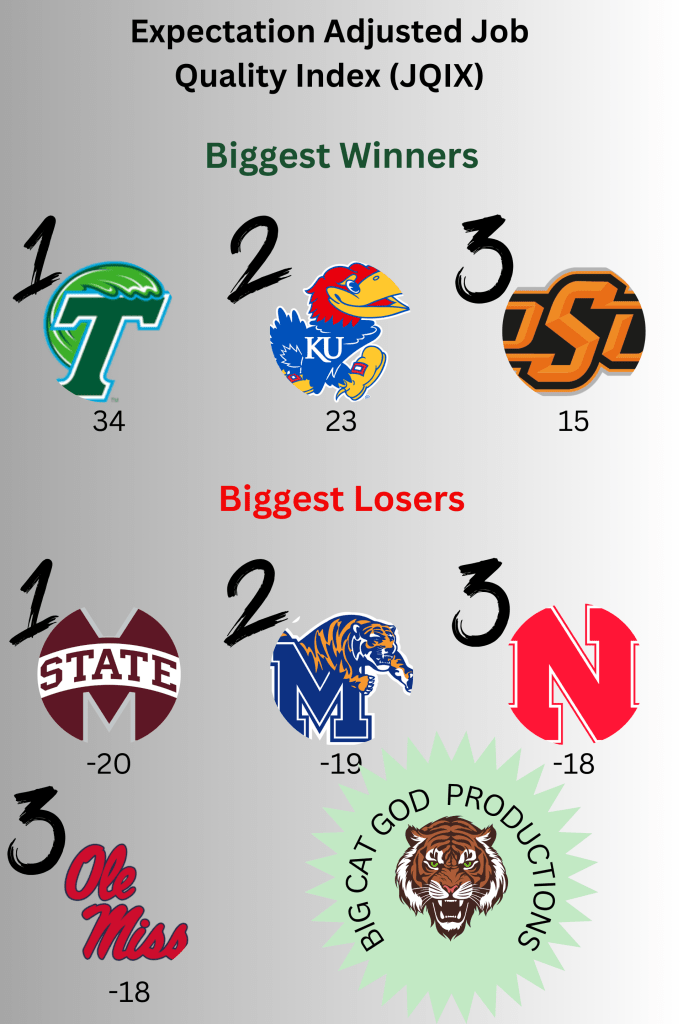
The interesting thing is not that Tulane has too little expectations for a currently winning team. Interesting is that the Big XII is so weak that its autobid will push their historically weak teams up. On the other end both Mississippi schools have expectations that are getting worse with the addition of Texas and Oklahoma in a crowded Big 2, P4 middle class. Memphis is likely in this position because the spend at the top of the AAC but don’t have great results or talent recently.
The metric thinks that Nebraska and Ole Miss are the exact same. They are tied in JQI (2.035, ranked at 32). They are also have similarly wild expectations which drops them both in JQIX (1.835, ranked at 50). This makes the jobs go from better than Tulane (72) and Kansas (62) in JQI and worse than Tulane (38) and Kansas (39).
How about the bottom?

Not much changes, the MAC gets a boost and leaves the bottom 10. Southern Mississippi is a big loser dropping to 122 just outside of the bottom 10. UTSA is being punished for being a new program.
Limitations
The assumption that past talent is an indication of future talent is on paper huge. But when you are looking at a job for 2024, it is a reasonable assumption.
Besides the subjective variables, the biggest issue was estimating revenue for private schools. I decided to use the average value of their conference. That vastly underestimates Notre Dame (Independents) and Liberty (CUSA). On the other end, Vanderbilt is overestimated by 10 spots or so. USC is an interesting case in that the average B1G revenue is high enough to not affect their status very much. The Big 2 money is very very good.
For Notre Dame, if they had the average ACC money, they would jump from #20 to #10 JQI. For Liberty, matching an AAC average catapults from #70 to #45, making it, one of the best G5 contenders.
One factor that might strengthen the metric is coach salaries. I think the total revenue already includes that factors. While it is unlikely that the next Alabama coach will be paid as much as Nick Saban, it becomes a bigger problem down the pyramid where the head coach might get the money but not enough assistant support and vice-versa.
Variable dependency
I hate R-squared. It is only really useful for a single variable linear model. However, it can make for an useful short hand in multivariate linear models if you want to see if any variable is vastly dominant over the others without actually analyzing the data.
Revenue and Talent have very high R2 towards JQI, 0.8491 for Revenue and 0.9051 for Talent. On the other hand PP has not, only 0.5676. The fact that PP is subjective and in a very short range makes this result expected.
If one of my students showed this data to me, I would tell them to throw the whole thing out and go with the clean Team Talent average as the best indicator. Non of these variables are really independent and the talent composites might as well be a lumped up variable.
You lose precision on the edges but you gain on everything else. It is simple, easy to source and gives you almost as much insight as the complete version.
Conclusion
I started this non work project to win an online argument. Proceeded to prove myself wrong. (Michigan State is a good job, apparently). Found out that I could have glanced on recruiting rankings and got basically to the same conclusion. SCIENCE!
The locked spreadsheet can be viewed at: https://docs.google.com/spreadsheets/d/1EZnhrbMRWOUrtE9hDjVTxIPQM9GkVPpX/edit?usp=sharing&ouid=100674460143226912630&rtpof=true&sd=true
